We value your privacy
This website uses cookies to ensure you get the best experience on our website.
 Skip to main content
This website uses cookies to ensure you get the best experience on our website.


At EyeQuant, we do a lot of eye-tracking as part of our mission to teach computers to see the...
Read more
When I’m chatting with clients, partners, and prospects, I find myself talking a lot about the idea of “visual...
Read more
Show me, don’t tell me: visually communicating your process eases tensions across departments, and will make your design meeting...
Read more
Last week in Malmö, Sweden, innovators like Reddit co-founder Alex Ohanian, branding expert Cindy Gallop, and EyeQuant’s very own...
Read more
There’s an age-old saying that goes, “The only thing that stands in the way of a business making more...
Read more
“If houses were built the way software is built, the first woodpecker would bring down civilization.” (Anon.) A building...
Read more
This is a guest post by Francis Teo, Lead Conversion Strategist at Conversions Guaranteed A/B testing is fast gaining popularity as...
Read more
108 Million Web Users Are Color Blind: How Do They See Your Website?
Read moreNo more posts to display
No more pages to load

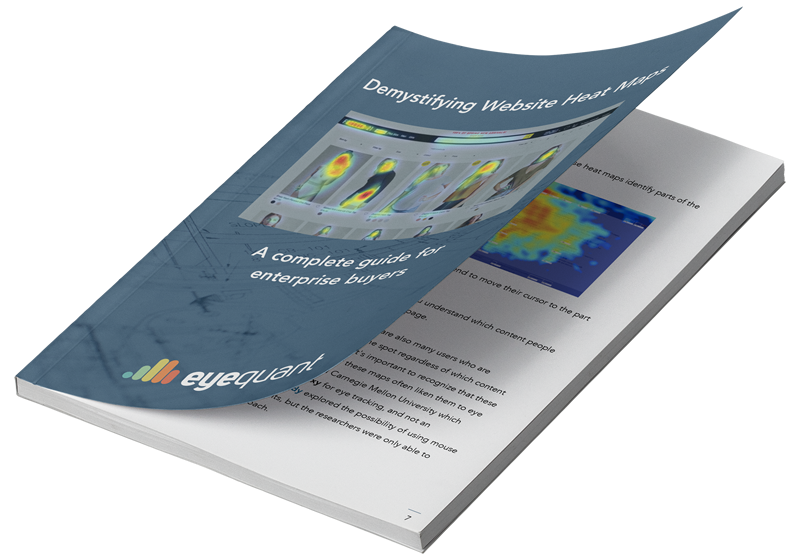
Heat maps: It’s probably the broadest, most popular category of insight tools available to any company that wants to understand and improve the user experience on their website.
They’ve been around for years, and most companies have used them at some time or another. They’re a staple tool for Analytics departments, Conversion Optimization teams, and User Experience professionals everywhere.


To learn how EyeQuant could improve your design process and increase conversion rates, book some time with one of our specialists.