We value your privacy
This website uses cookies to ensure you get the best experience on our website.
 Skip to main content
This website uses cookies to ensure you get the best experience on our website.
Put simply, eye tracking is the process of using technology to measure eye movements. Eye movements such as saccades (quick movements), fixations (steady gaze), and smooth pursuit (following a moving object) help determine what is being perceived and more importantly, how attention is being distributed.
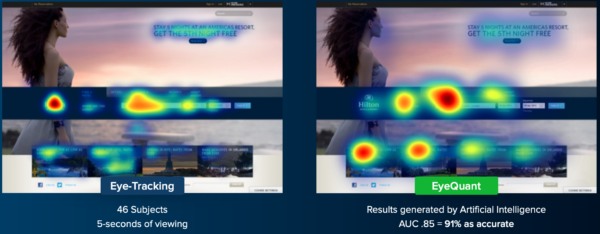
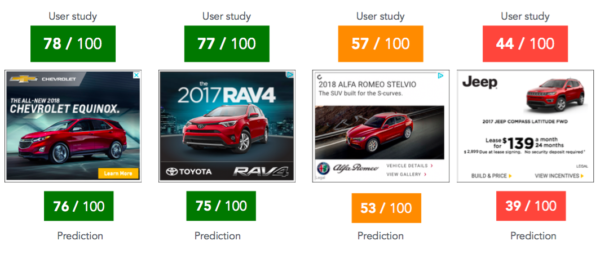
Advancements in AI have enabled us to take empirical eye-tracking data (which, in our case is collected by our dedicated research team at the University of Osnabrueck) and train artificial neural networks to predict how the human eye will respond to visual stimuli. Accuracy scores are then calculated by comparing key statistical metrics for predictions vs. empirical eye-tracking data.
In the example below, you can see that EyeQuants prediction (on the right) is 91% as accurate as running a eye-tracking experiment with 46 participants.
With adults now spending more than a quarter of their waking day online – the highest on record – it’s never been more important to craft compelling digital experiences. For many years, the most successful and interesting companies have put data-driven design at the forefront of their product offerings. As a result, consumers expectations have been set high.
Globally, UX, marketing and product teams have all been forced to work remotely from home, and thus, come up with creative solutions for obtaining user data during the design and creation phase. It’s no longer acceptable to wait until you’ve pushed a design live and have a plethora of behavioural data to run tests. Optimisation needs to happen during the design phase, before you go live. Here’s how some of the most popular brands and teams are using predictive eye-tracking data to prosper:
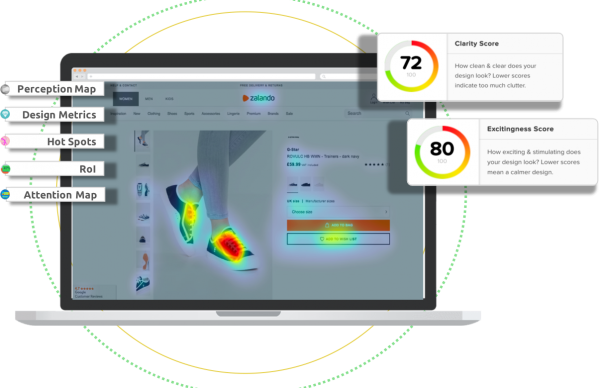
With EyeQuant’s analytics you can create products and experiences that are compelling and easy to use.
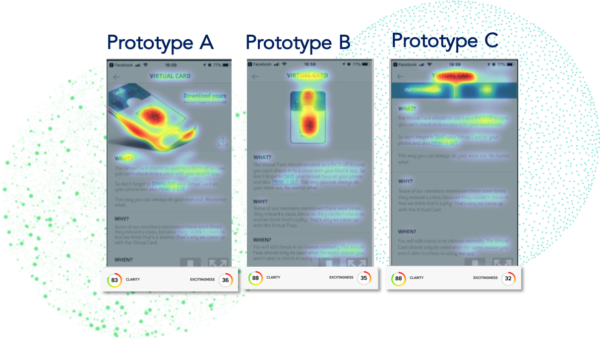
2. When multiple elements of a page, like the position of a sign-up form, header, CTA or imagery, are up for debate you can run multivariate tests with EyeQuant to instantly see which design will achieve your design goals – that’s before you go live so there’s no wasted website traffic!
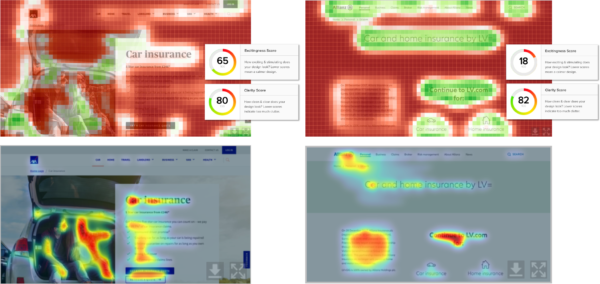
3. Benchmark your high-fidelity wireframes and prototypes against your nearest competitors to capture user attention in a way that sets your products apart.
4. It’s time to ensure your teams can create exceptional and consistent enterprise experiences at scale. Ensure your Design System has quantifiable design standards with EyeQuant Design Metrics scores.
5. Shine a spotlight on the design elements that are causing cognitive load and preventing users from converting.
Whether you’re using Tableau, Qlikview, FusionCharts, Highcharts, Datawrapper or any data visualisation tool to provide a way for your teams to understand patterns in data, it’s integral that the most important data is accessible. Whilst y9u may not be looking to drive action, the most important data needs to be instantly visible.
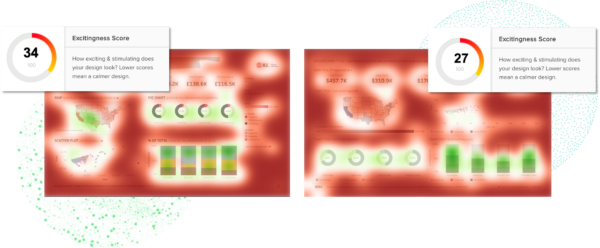
2. Cross-device testing – Its important to test your dashboards on the mobile browser to ensure users can see the most important data while on the go. Especially important if you’re using dynamic dashboards.
3. Create high-fidelity mockups to facilitate discussions with data users to surface and prioritize issues, requirements, and solutions. Use EyeQuant scores to prove or disprove dashboard design hypotheses.
![]()
Turning an idea into a marketable product is complex and multifaceted. With EyeQuant’s analytics your development team can start building digital products with greater insight and confidence.
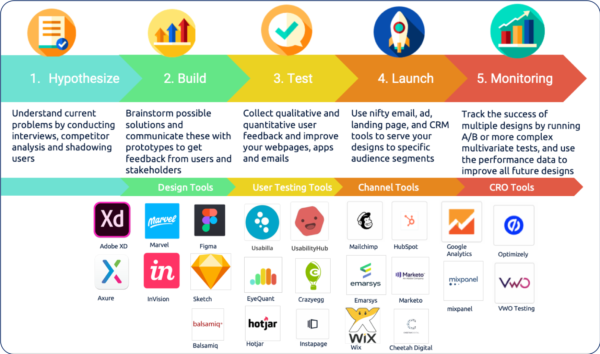
With human attention span at all time low, you cannot expect your target audience to read long blog posts with large blocks of text.
Check out our latest top tips on how you can use EyeQuant to spy on your competitors, analyse mobile...
Read more
In our latest blog we explore how to use neuroscience to help create higher performing digital products.
Read more
Figma is the go-to prototyping platform for many UX and web designers – and not without reason. Its functionality,...
Read more